What Is Open Interest? Trading OI with CVD
What open interest is, how it differs from volume, the four OI flow buckets, and how to pair OI with CVD to read squeezes, traps and stealth accumulation.
A green candle at resistance tells you price went up. It does not tell you whether new money came in to push it, or whether trapped shorts were just stopped out. Open interest is the one number that separates those two worlds — and once you read it next to price and aggression, a lot of "random" moves stop looking random.
This guide is the trader's manual for open interest. What it is, how it differs from volume, the four flow regimes it reveals, the misconception that ruins most people's read, and — the part that prints the cleanest setups — how to pair open interest with CVD to tell real moves from squeezes, traps and stealth accumulation.
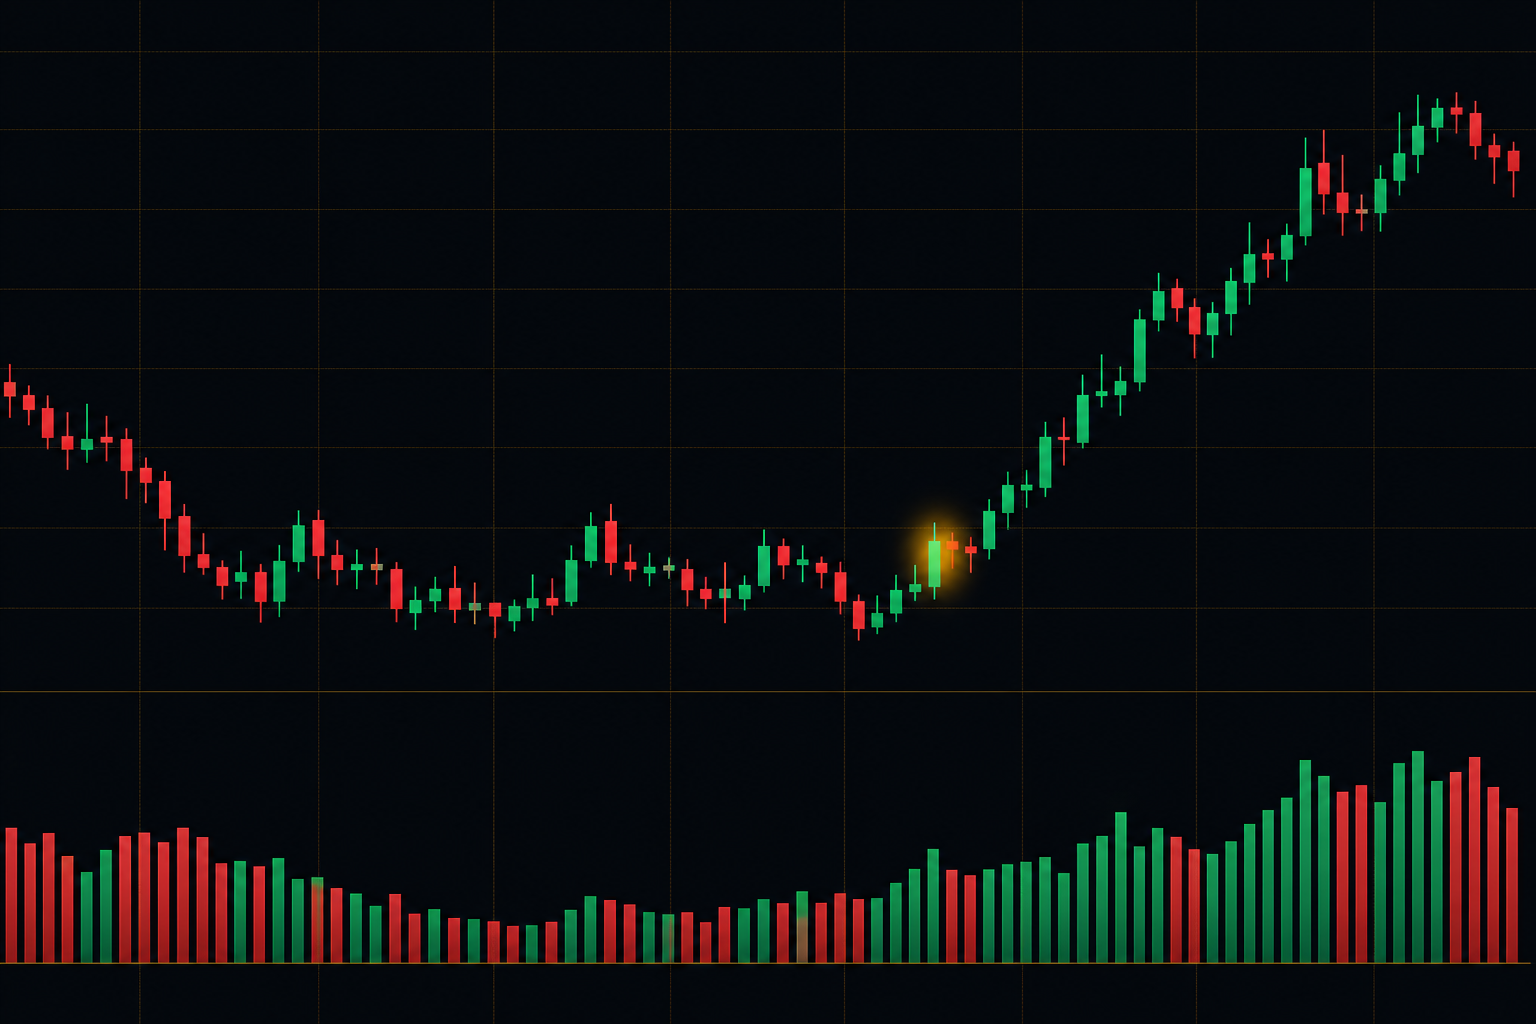 Open interest plotted as a column histogram below price. Each bar is colour-classified by what the positioning did that candle — new longs, new shorts, or a squeeze — and a halo flags the candles where positioning surged hardest.
New to order flow? This article sits in the same cluster as the Depth Heatmap Complete Guide (resting liquidity), the CVD Profile guide (signed flow at each price), and the Liquidation Heatmap guide (forced-exit fuel). Open interest is the fourth lens — it tells you whether capital is entering or leaving the contract.
What is open interest?
Open interest (OI) is the total number of outstanding derivative contracts — futures or options — that have not yet been settled. It tracks every position still open in a specific contract, rather than the overall trading volume. Because every contract has a long on one side and a short on the other, open interest counts the matched pairs of positions that remain live.
That makes it a cleaner picture of liquidity and committed interest than volume alone:
- An increase in open interest means new or additional capital is flowing into the contract — fresh positions are being opened.
- A decrease in open interest means capital is leaving — existing positions are being closed.
To really understand open interest, hold one fact in your head: traders can buy and sell to open a position and to close one. Whether a trade increases, decreases, or leaves open interest unchanged depends on whether the two traders involved are opening fresh or unwinding existing positions.
One important nuance for crypto traders. In traditional futures and options markets, open interest is published once per day after settlement. On crypto perpetual contracts there is no daily settlement, so open interest updates continuously throughout the day. Everything in this guide applies to both — just remember that on perps you are watching OI move in real time, bar by bar.
Open interest measures capital flow
Open interest is, at its core, a measure of the flow of capital into or out of a market. Low or near-zero open interest means there are almost no open positions — nearly everyone has closed out. High open interest means many contracts remain open, which means market participants are actively committed to, and closely watching, that market.
That is the whole significance of the number: it is a gauge of how much committed capital is at stake right now, not a prediction of where it will go.
Open interest vs volume — the difference that matters
Volume and open interest both describe the liquidity and activity of a contract, but they measure different things, and confusing them is one of the most common beginner errors.
| Volume | Open Interest | |
|---|---|---|
| Counts | Every transaction completed | Positions that remain open |
| Tells you | How much activity happened | How much committed positioning exists |
| Behaviour | Accumulates over the session | Rises or falls as positions open/close |
| Best read as | Strength and level of interest in a trade | Whether capital is entering or leaving |
Volume reflects the total activity throughout the trading window — it is a key indicator of the strength and level of interest behind a particular move. Open interest reflects the number of contracts held by traders in active positions, ready for trading.
The classic example: a single trade can add volume without changing open interest — when one trader closes a long by selling to another trader who is also closing a short, both sides exit and the contract count stays flat even though volume ticked up. The same-sized trade adds both volume and open interest when two traders open a brand-new contract between them. That is why you read the two together, never alone.
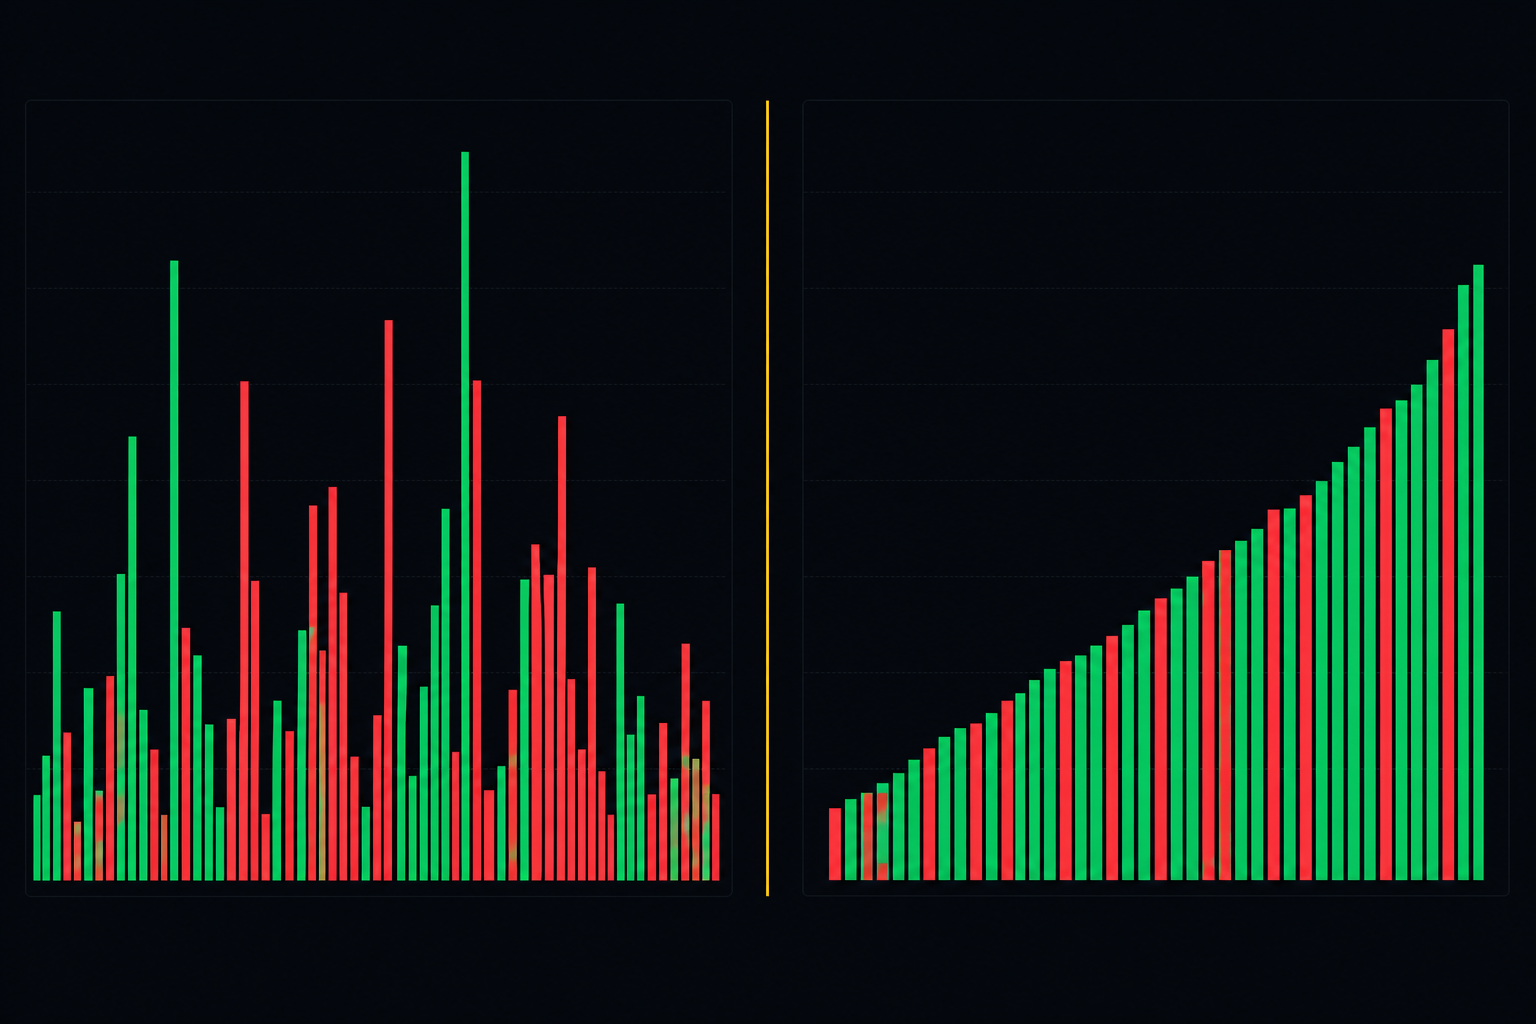 Volume measures activity, open interest measures committed positioning. On the left, volume ticks up while OI stays flat — traders swapping positions, not adding new ones. On the right, both rise — fresh contracts being opened.
The four flow regimes — reading OI next to price
Open interest only becomes a signal when you read its change against the direction of price. There are exactly four combinations, and they define the regime. Memorise this table — it is the heart of OI reading.
| Price | OI | Regime | What it means |
|---|---|---|---|
| ▲ | ▲ | Long buildup | New longs opening. The trend has real fuel; expect continuation up while OI keeps expanding. |
| ▼ | ▲ | Short buildup | New shorts opening. Real selling pressure; expect continuation down. |
| ▲ | ▼ | Short squeeze | Shorts covering, not new buyers. The move is fragile and fades once shorts are flushed. |
| ▼ | ▼ | Long squeeze | Longs capitulating, not new sellers. Move is fragile; bounces often follow. |
The two buildup rows are continuation regimes — capital is entering on a side, so the move has a backer. The two squeeze rows are exhaustion regimes — capital is leaving, so the move is running on forced exits rather than conviction, and it tends to reverse once the trapped side is cleaned out.
This is the read the Open Interest indicator automates: every bar in the sub-pane is colour-classified into one of these four buckets (green long buildup, red short buildup, plus distinct colours for the two squeezes), so you can scan the regime at a glance instead of doing the price-vs-OI maths in your head.
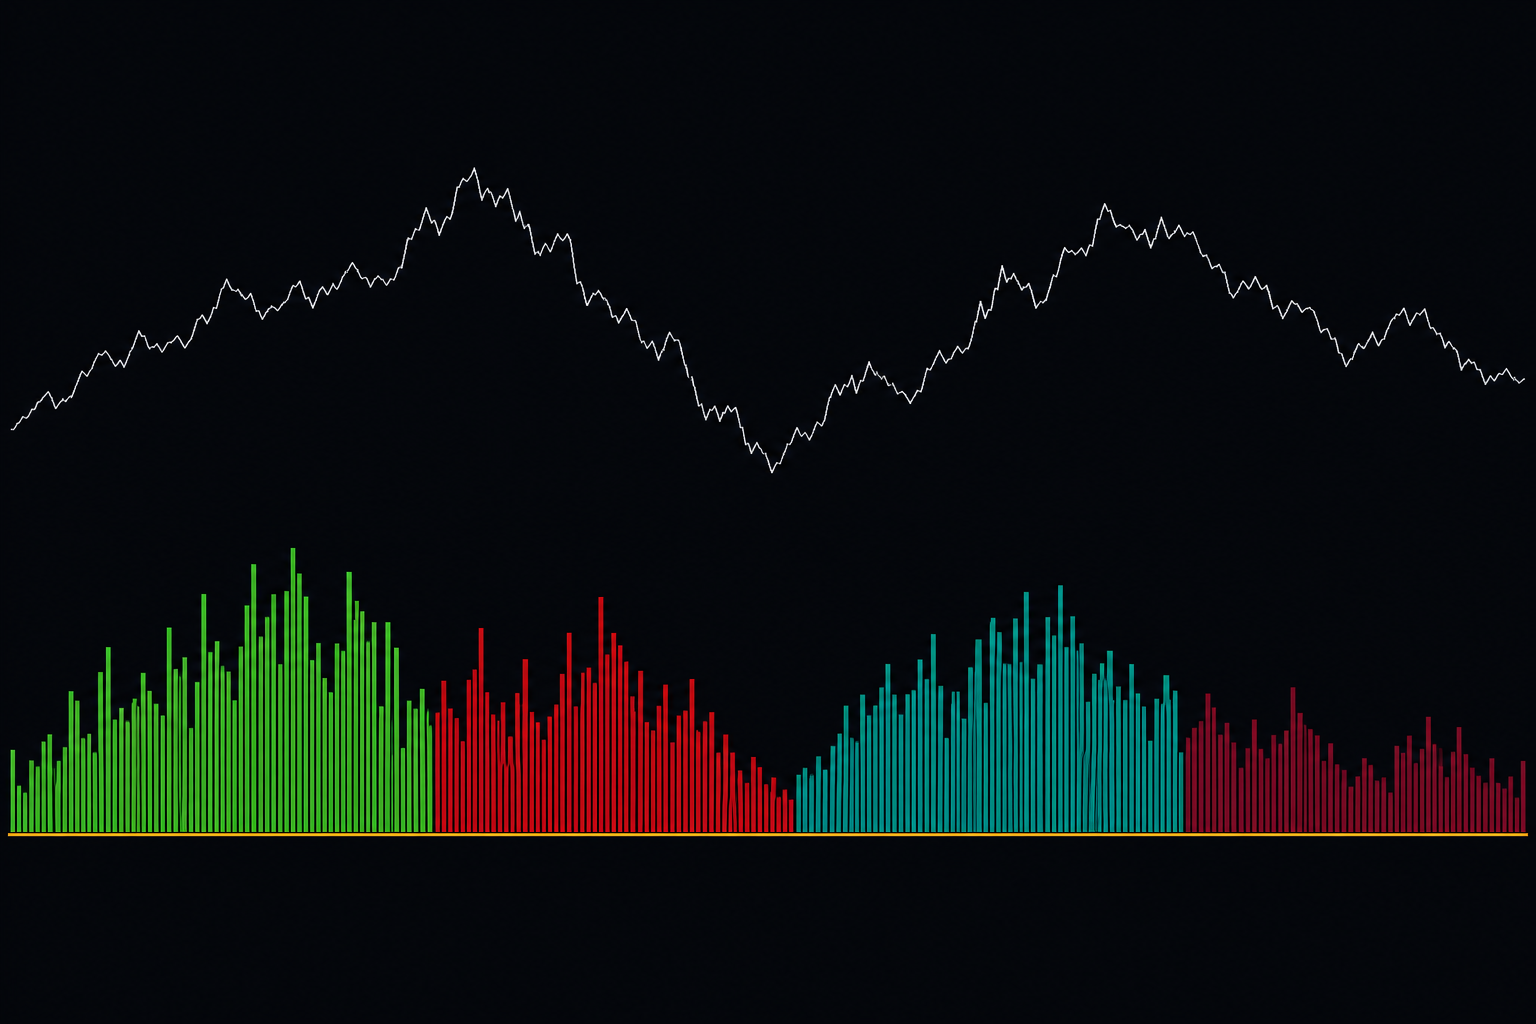 The four flow regimes colour-coded on the OI pane. Buildup bars (capital entering) back a continuation; squeeze bars (capital leaving) mark a fragile, forced move that tends to fade.
The misconception: open interest does not predict price
A common misconception about open interest lies in its supposed predictive power. New traders believe a high (or low) open-interest reading forecasts the next move. It does not.
High or low open interest simply reflects traders' interest and sentiment toward the current market. It tells you how much capital is committed — not which direction that capital will be right. Open interest is a context instrument, not a crystal ball. It earns its keep only when combined with price direction (the four regimes above) and with aggression (CVD, below).
In summary: open interest reflects traders' interest and sentiment toward the current market. Read it as a gauge of committed capital, never as a price forecast.
Why high open interest matters — liquidity
High open interest creates opportunities for both buying and selling. That liquidity lets traders enter and exit positions quickly, with less slippage and a tighter gap between the price one trader wants and what another is willing to pay. When liquidity is low (low open interest), traders have far less flexibility getting in and out.
So is higher open interest "better"? For tradability, generally yes — higher open interest usually means greater liquidity and easier execution. And there is a trend signal in it too: if open interest keeps rising and stays high while a move develops, it signals the trend behind that contract is likely to persist, because fresh capital keeps backing it.
But "higher is better" has a ceiling. When open interest rises too far, too fast, the book becomes crowded and fragile — a small reversal can trigger a cascade of forced exits. Extreme open interest at an extended price is a warning, not a green light. Which brings us to what happens as OI changes.
What price trend follows a change in open interest?
- Open interest increasing usually indicates new buying activity and fresh capital entering for that contract. As long as that continues, the current trend is likely to persist — this is generally a trend-continuation signal. The caveat from above still holds: if OI rises too high relative to price, it can flip to a bearish/contrarian warning that a crowded book is about to unwind.
- Open interest decreasing is a sign the market is liquidating — more participants are exiting than entering. This usually suggests the current price trend is running out of road and may be coming to an end.
The simplest framing: rising OI = the move has a backer and is likely to continue; falling OI = the move is being driven by exits and is likely near exhaustion.
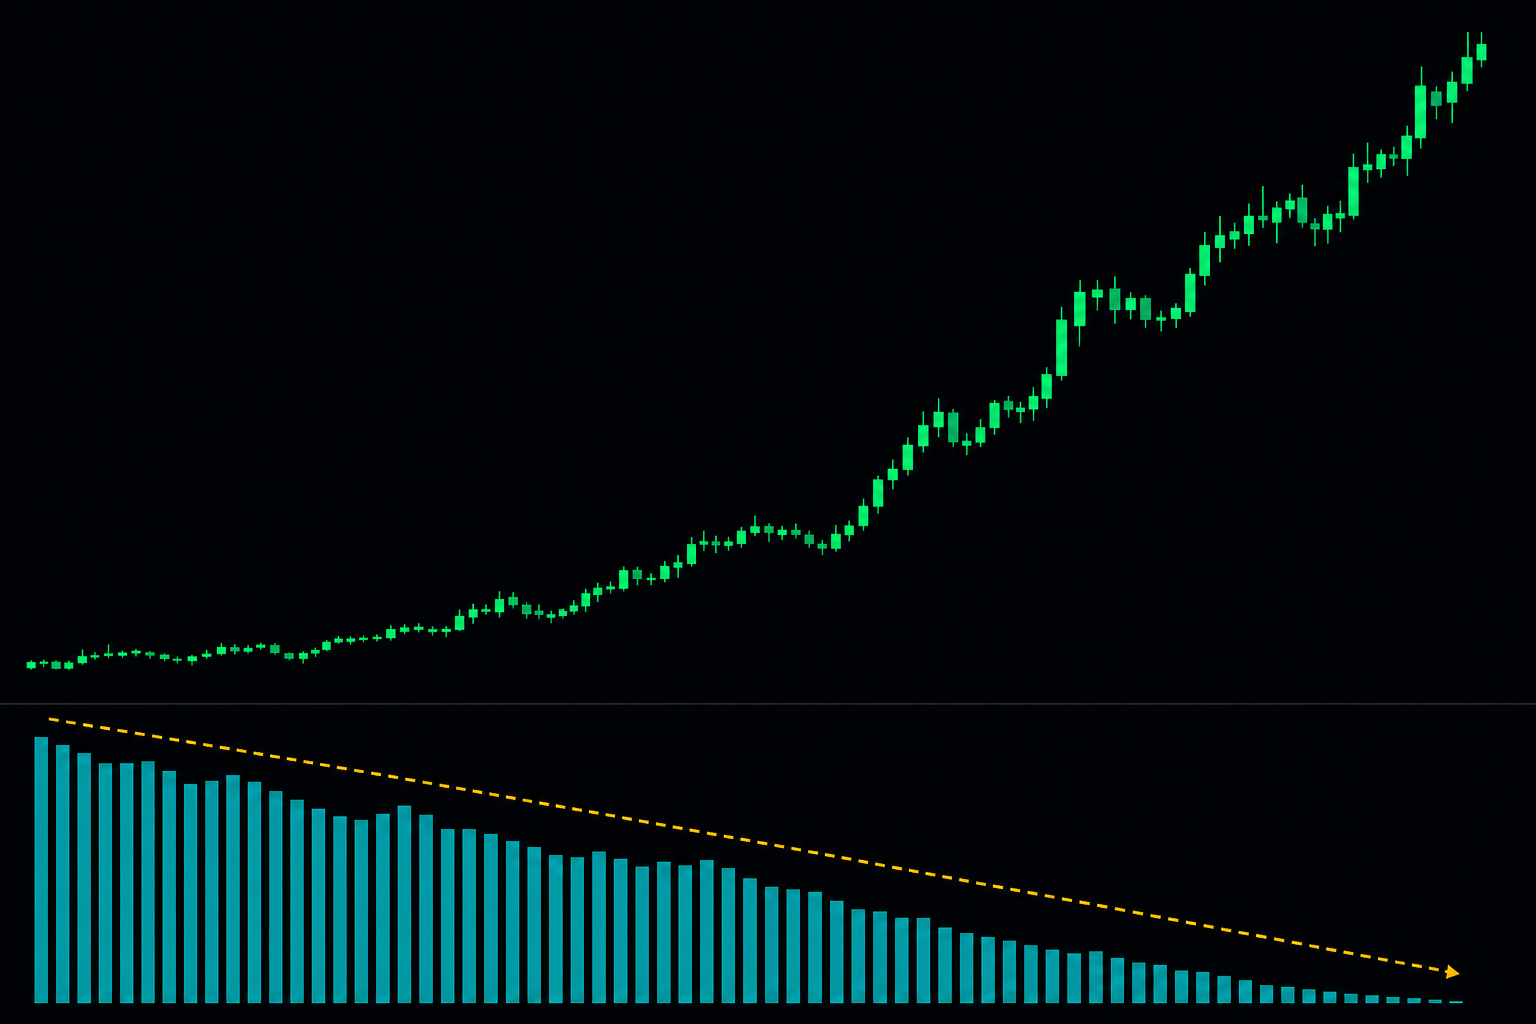 A rally on falling open interest. Price is rising, but capital is leaving the contract — shorts covering, not new longs. The move is fragile and tends to fade once the trapped shorts are flushed.
Pairing open interest with CVD
Open interest has one blind spot: it tells you how many positions opened or closed, but not who was the aggressor — buyers or sellers. That is exactly what CVD (cumulative volume delta) supplies: the running sum of taker-buy minus taker-sell volume, i.e. which side was hitting the market.
Read together they triangulate the move:
- OI — is capital entering or leaving the contract?
- CVD — who is doing the aggressing, buyers or sellers?
The power is in the agreement and the mismatch between them:
| OI | CVD | Reading |
|---|---|---|
| Rising | Confirms price direction | Genuine move — new positions, aggressed in the trend direction. Real fuel. |
| Rising | Flat / balanced into compression | Stealth build-up — someone is loading a position quietly without paying up. Pre-breakout. |
| Spikes on a breakout | Immediately reverses | Trapped traders — late entries piled in, then got faded. Reversal setup. |
| Falling | Opposes the move | Squeeze — forced exits, not conviction. Fragile. |
Smart-money footprints rarely show up as a clean signal on a single stream — they show up as a mismatch between OI and CVD. That is the entire premise of the OI / CVD Pattern detector, which watches price, OI and CVD together and labels four recurring setups on the chart:
ACCUM(bullish) — stealth accumulation: OI rises while price compresses and aggression stays balanced. Somebody built a long position without paying up. Best near a range low or prior support.DIST(bearish) — stealth distribution: the mirror image near a range high.TRAP-L(bearish) — failed long breakout: a thrust into a fresh high backed by an OI surge that immediately fades. Late longs are now offside.TRAP-S(bullish) — failed short breakdown: trapped shorts must buy back, fuelling the bounce.
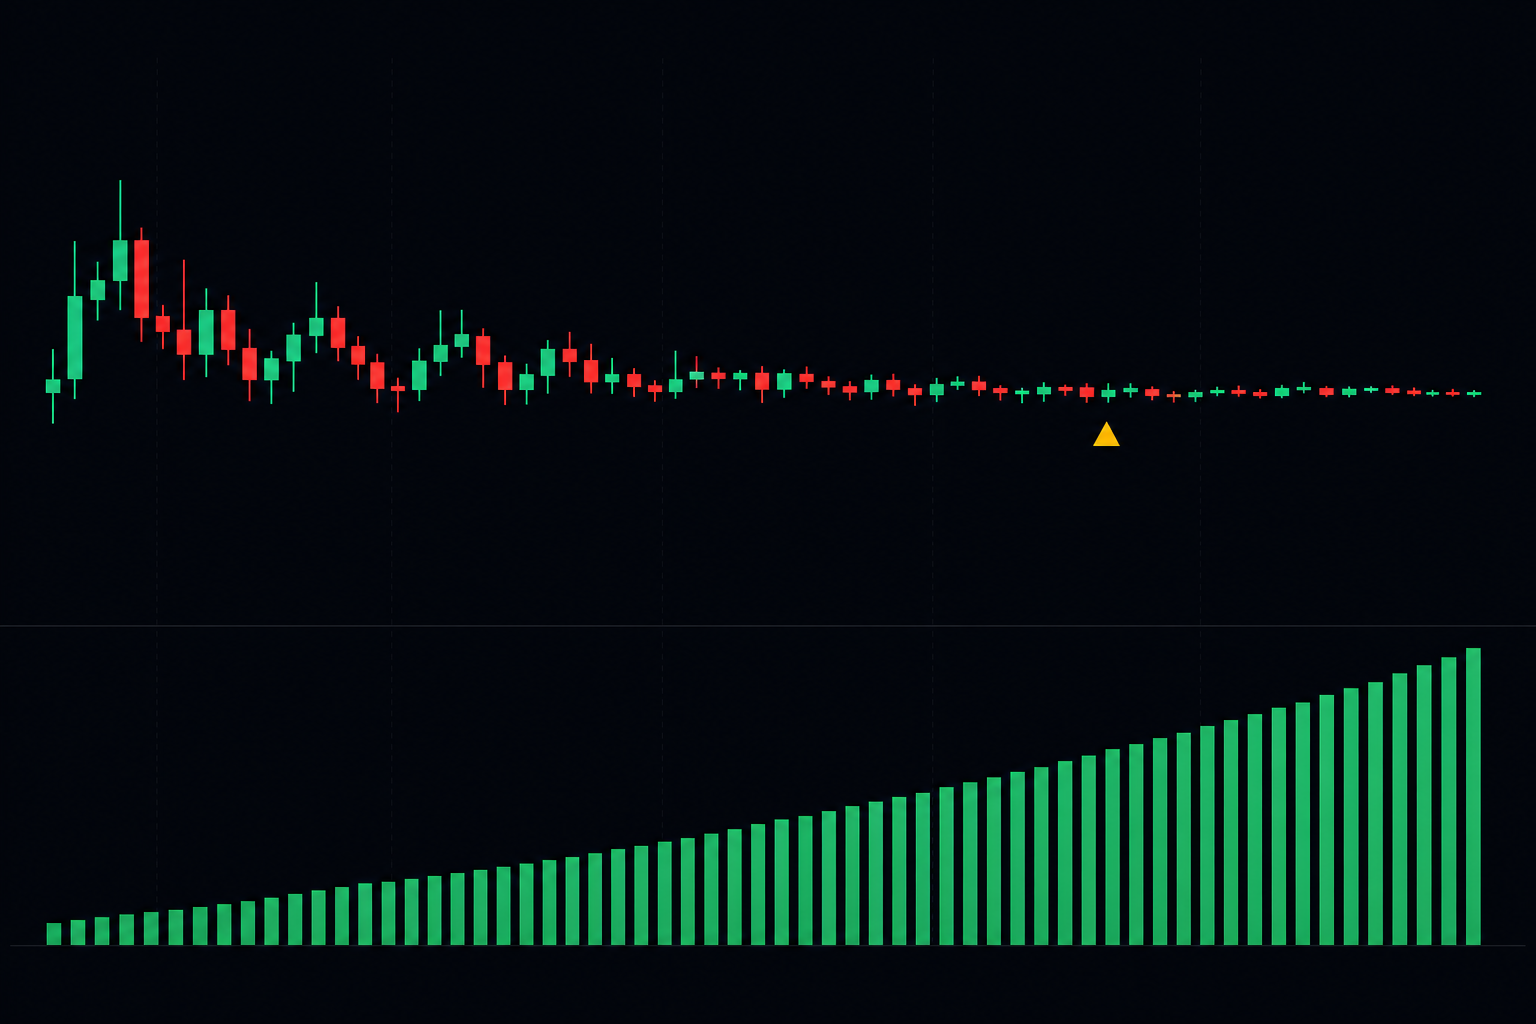 Stealth accumulation: price compresses, open interest rises, and CVD stays balanced — a position is being loaded quietly without aggressing the tape. The breakout that follows is the trade; the build-up is the warning.
Open interest divergence
The most actionable OI-plus-price pattern on its own: price prints a new high while the bar-over-bar open-interest change shrinks. Conviction is draining even as price holds up — fewer and fewer new positions are backing each push. Pullback risk rises. Mirror it on the short side: price makes a new low while OI change fails to grow, and the down-move is losing its backer.
This is the same logic as a CVD divergence, one layer up: instead of "aggression is fading", it is "fresh positioning is fading". When both diverge at once — price at a new extreme, OI change shrinking, and CVD failing to confirm — that is one of the strongest exhaustion tells available to a derivatives trader.
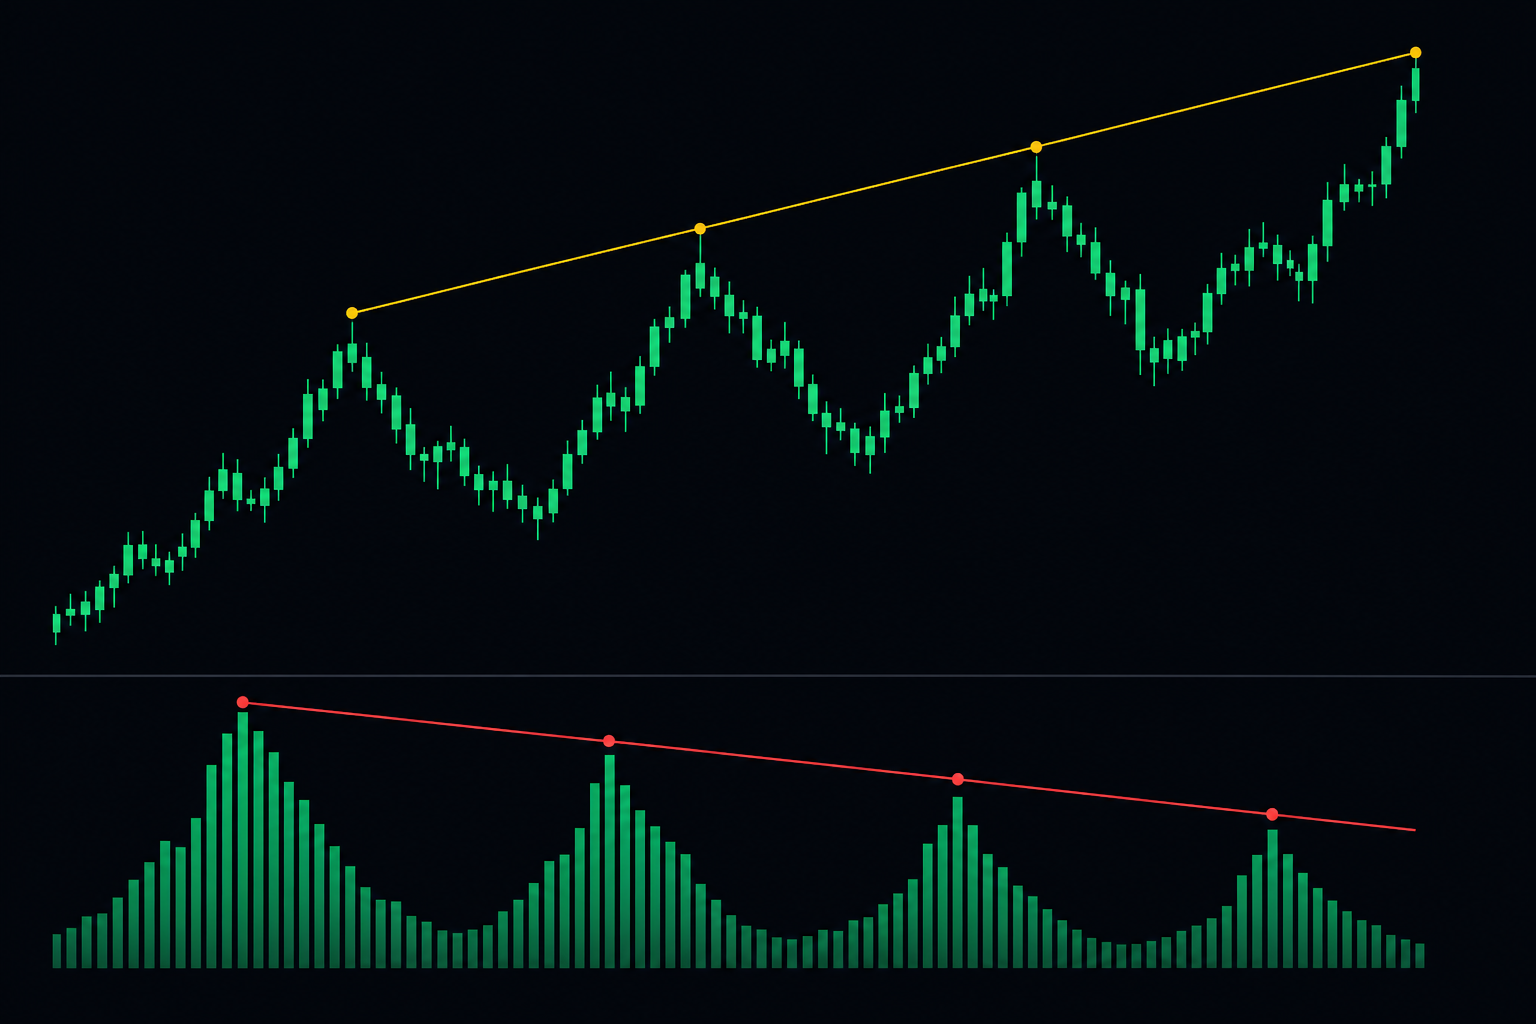 Open-interest divergence: price keeps making higher highs, but each push is backed by smaller and smaller OI expansion. The crowd's appetite to open fresh longs is fading — a classic pre-pullback warning.
Volume + open interest scenarios
Traders use changes in volume and open interest together to assess liquidity and read where a trend stands. These are the canonical combinations:
- Uptrend, price rising, OI rising → new capital flowing in on new positions. Bullish, especially when the OI increase is driven by fresh long buildup. The trend has a backer.
- Uptrend, price rising, OI falling → capital leaving even as price climbs. The rally is running on short covering, not new buying — a bearish/fragile signal under the surface.
- Downtrend, price falling, OI rising → new capital entering on the short side. Consistent with the continuation of a bearish trend.
- Downtrend, price falling, OI falling → holders being forced to liquidate. Bearish, but the falling OI also warns a selling climax may be near — capitulation tends to mark the end of the leg.
- Market peak, price falling sharply, OI still high → bearish. Traders who bought near the top are now offside; a high open interest sitting in losses can tip into panic selling.
Notice the pattern: rising OI confirms the prevailing trend (capital backing it), while falling OI warns the move is being driven by exits and is closer to exhaustion.
Common mistakes
Reading open interest as a price forecast. The single biggest error. High OI does not mean "price will go up". It means a lot of capital is committed. Direction comes from price and aggression, not from the OI level itself.
Confusing volume with open interest. Volume is activity; open interest is committed positioning. A volume spike with flat OI is traders swapping positions, not new conviction entering. Always check which one moved.
Treating a squeeze like fresh conviction. A rally on falling OI is shorts covering, not new buyers — it is fragile. Chasing it because "price is pumping" is how you buy the top of a squeeze.
Calling a trend off one bar. A single rising-OI candle tells you positions opened on that bar. A real regime shows sustained expansion over several bars, not one lonely spike surrounded by flat readings.
Reading OI on a spot symbol. Spot markets have no open interest — the pane is blank for a reason. Switch to the perpetual contract to get the OI read back.
Ignoring the CVD cross-check. OI alone can't tell real moves from squeezes and stealth build-ups. The mismatch between OI and CVD is where the edge lives — read them together, not in isolation.
Trading a pattern marker without a level. A stealth or trap signal in the middle of a chop range has nothing to anchor against. Pair every OI/CVD signal with a structural level — range edge, prior POC, support/resistance — and you'll skip most of the marginal entries.
A simple pre-trade checklist
Run through these before acting on an open-interest read. Any "no" is a pass.
- Is the symbol a perpetual / futures contract (not spot), so OI data exists?
- Which of the four regimes is in play — buildup (continuation) or squeeze (fragile)?
- Does CVD agree with the OI read, or is there a mismatch (stealth / trap)?
- For continuation: is OI rising to back the move, not falling?
- For a reversal: is there an OI divergence or a trapped-trader fail, confirmed by price action?
- Is there a structural level anchoring the signal?
- Is risk-to-reward at least 2:1 after fees, with size within your per-trade risk limit?
All yes — execute.
Where to go from here
Open interest is the "is capital entering or leaving?" lens. It is strongest beside the other order-flow tools:
- Open Interest Patterns: Reversal & Continuation — the patterns playbook built on these foundations: the four scenarios, OI divergence, squeeze exhaustion and climax spikes, each illustrated.
- Trading with CVD Profile — the aggression side of the story. OI tells you positions are opening; CVD tells you who is doing the aggressing and where.
- Trading Chart with Depth Heatmap — Complete Guide — resting liquidity. Where the walls are that an OI buildup will have to push through.
- Liquidation Heatmap + RSI — what happens when the squeezes OI flags actually trigger forced exits.
- What Is a Footprint Chart? — intrabar signed flow for timing the entry once OI and CVD line up.
- Open Interest indicator reference and OI / CVD Pattern detector — settings, flow classification, burst signals and the four auto-detected patterns, wired into alerts on the Tape Delta chart terminal.
When you're ready to test it live, open the chart terminal, switch to a perpetual pair, and toggle Open Interest and CVD from the indicator panel. Regimes, squeezes and stealth build-ups get a lot easier to see once both lenses are on.
Bottom line
Open interest does not predict the future. It tells you whether capital is entering or leaving a contract right now — and that single fact, read against price direction and CVD aggression, separates real moves from squeezes, continuation from exhaustion, and genuine breakouts from trapped traders.
Read OI for the flow of capital, CVD for the aggressor, and price for the structure. When all three agree, you have conviction. When OI and CVD disagree, you have the most valuable signal of all — a footprint someone was trying to hide.
This article is education, not financial advice. Trading involves risk; never risk capital you cannot afford to lose.