Building a Native GPUI Chart in Rust: A GEX Gamma Heatmap
A production Rust charting library that renders candlesticks, an orderbook heatmap, and a GEX gamma-exposure heatmap natively — the same engine embeds in a GPUI desktop app and on the web.
Most charting libraries answer one question: "how do I put a chart on a web page?" This post answers a different one: "how do I embed a real trading chart — candlesticks, an orderbook heatmap, and a GEX gamma-exposure heatmap — inside a native GPUI desktop app in Rust?" And it shows that the same engine also runs on the web, so you build once and ship to both.
We build kline-orderbook-chart. It started as a web chart engine and grew a native path, because a serious trading terminal eventually wants to leave the browser: lower latency, no tab throttling, direct GPU access, and a single binary you control. This is how it works.
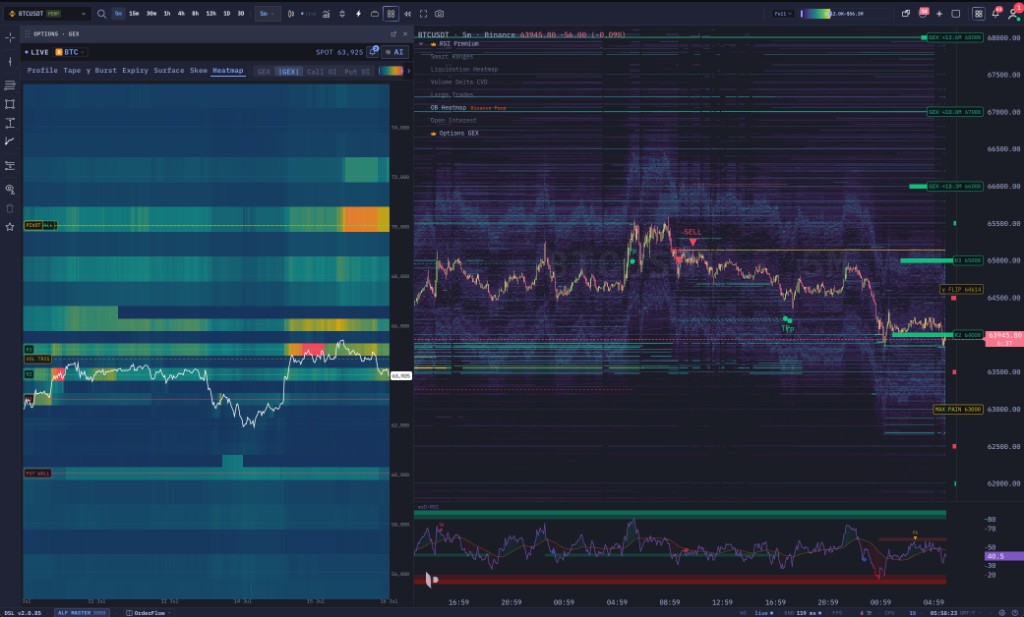 A native terminal: the GEX gamma heatmap (left) and the kline + orderbook-heatmap chart (right), one engine driving both panes.
Why a native chart at all?
The web is a great distribution channel and a hostile runtime for a chart. Background tabs get throttled to 1 fps. Garbage-collection pauses land mid-pan. Canvas is a single-threaded raster target with no direct GPU control. For a chart a trader stares at for eight hours, those tradeoffs add up.
A native build removes them: predictable frame pacing, real threads, GPU-backed painting through GPUI / wgpu / skia, and no browser sandbox between you and the metal. The catch has always been that going native meant rewriting your chart. It does not have to.
One engine, one command buffer
The core idea that makes web-and-native possible with no rewrite: the engine never touches a canvas or a GPU directly. Each frame it computes a compact, renderer-agnostic draw stream — fills, strokes, text, and heatmap rasters in logical coordinates.
On the web, a thin layer reads that stream and paints to <canvas>. Natively, you read the same stream and call your painter. The engine does not know or care which one it is.
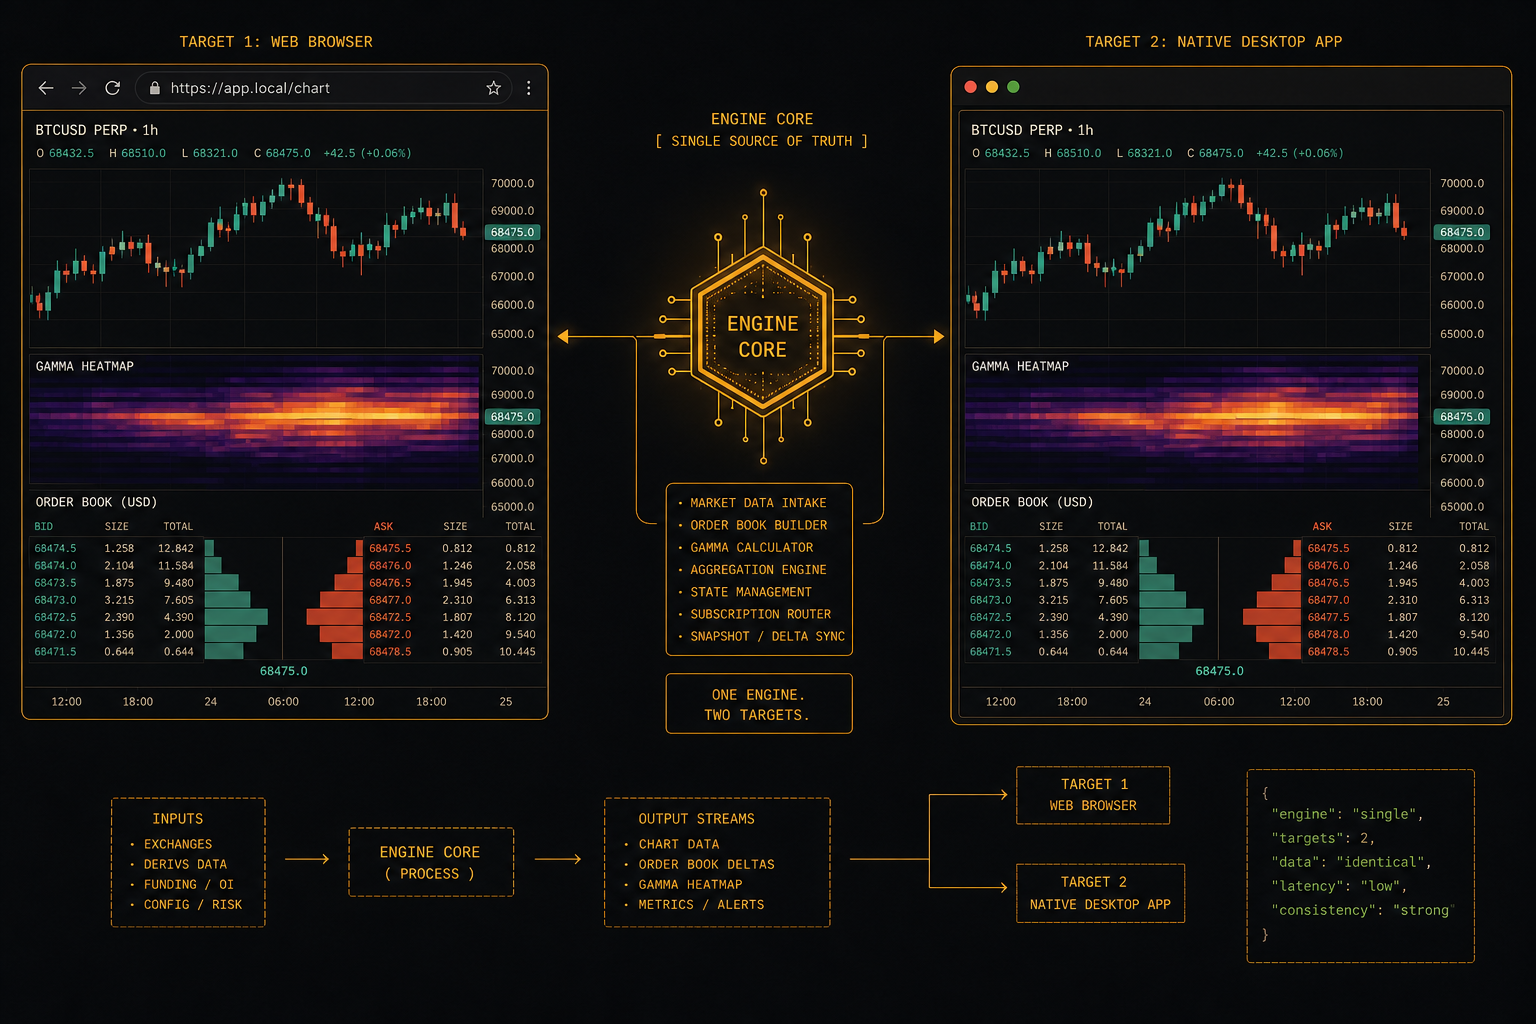 Same draw stream, two dispatchers — a browser canvas and a native GPUI window.
The native path (no browser)
No JavaScript, no browser runtime, no canvas bridge. Licensed customers get a precompiled native engine plus a thin, source-visible decoder / adapter. Your app:
- Links the licensed native binary and activates the licence key you were issued.
- Feeds live OHLCV (and optional heatmap / GEX matrices) into the engine.
- Each frame, drains the draw stream and maps it onto your painter (GPUI, wgpu, skia, …).
The concrete crate surface, method names, and wire layout ship inside the licensed SDK — not on this public page. Contact [email protected] for native access; a buildable reference GPUI adapter is included so you do not invent the paint mapping from scratch.
Wiring it into GPUI
GPUI is the Rust UI framework behind the Zed editor: retained-mode elements, a GPU-backed painter, and a tight frame loop. The chart becomes a single custom element:
- On resize / layout, tell the engine the logical size of the pane.
- In the element's paint pass, ask the engine for the current frame's draw stream.
- Map each draw op onto GPUI primitives (quads, paths, text, heatmap raster).
- Forward pan / zoom / crosshair from GPUI input events into the engine's viewport, then request a repaint.
That is the whole native loop — a thin adapter around a closed engine binary. Start from the reference GPUI adapter in the SDK rather than writing the paint map by hand.
The GEX gamma-exposure heatmap
GEX (gamma exposure) turns the options chain into a map of where dealers are forced to hedge. From the open interest at each strike you estimate dealers' net gamma; positive-gamma zones tend to pin price (dealers sell rallies, buy dips), negative-gamma zones tend to accelerate it. Rendered as a heatmap — price on Y, time on X, cell color by dealer gamma — you can see those magnet and accelerant zones at a glance, and line them up against the spot candles in the next pane.
Mechanically it rides the same heatmap-raster path as the orderbook depth heatmap; only the input matrix differs (dealer gamma per strike instead of resting size per price). The engine renders both the same way, natively and on the web, so the GEX pane in the screenshot above is the identical code path as the depth heatmap in the chart pane. New to GEX? Start with What Is Gamma Exposure (GEX)? A Trader's Guide and GEX Heatmap Explained.
What you get in the box
The native SDK is not a candle-only stub — it is the full engine:
- Candlesticks with O(1) amortised appends for live bars.
- Orderbook depth heatmap — resting liquidity behind the candles.
- GEX gamma heatmap — dealer gamma by strike over time.
- Footprint cells — bid×ask executed volume, POC, delta, stacked imbalances.
- Liquidation heatmap — force-close clusters as an overlay.
- 18+ indicators — VRVP, CVD, TPO, RSI, MACD, Open Interest, Funding, and more.
- Custom indicators — a sandboxed scripting language, no fork required.
Every one of those feeds the same draw stream, so every one renders identically on the web and in your GPUI window.
Web and native, from one build
To be explicit, because this is the part that is genuinely rare: the same engine core produces both targets.
- Web — install
kline-orderbook-chartfrom npm, hand it a<canvas>, feed OHLCV, done. See Kline Chart With Orderbook Heatmap: A Library Guide. - Native — licence the precompiled engine plus open decoder/adapter (engine source is not sold), wire the reference GPUI / wgpu / skia adapter, done.
Same candles, same heatmaps, same numbers, same drawing tools. You do not maintain two charts; you maintain one engine and two thin dispatchers.
Where to go next
- Kline Chart With Orderbook Heatmap: A Library Guide — the web side, with install + streaming code.
- Choosing an Orderbook Heatmap Chart Library: A Buyer's Guide — how to score any candidate.
- What Is Gamma Exposure (GEX)? · GEX Heatmap Explained — the concept.
- Docs: Charting Library · Getting Started · Native & Desktop
- Code: GitHub — kline-orderbook-chart · npm · GPUI
Built with kline-orderbook-chart — a Rust chart engine for web and native. Free for development, commercial licences for production. This article is engineering documentation, not financial advice. Trading involves risk.