Kline Chart With Orderbook Heatmap: A Library Guide
How to render a kline candlestick chart with a real-time orderbook depth heatmap behind the candles — in one canvas, at native speed. Install, code, and streaming.
If you have searched "kline chart with orderbook heatmap", "candlestick depth heatmap library", or "orderbook heatmap JavaScript", you have hit the same wall everyone does: plenty of libraries draw candles, plenty draw a heatmap somewhere on the page, and almost none draw resting orderbook liquidity behind the candles in one synchronized canvas. This guide shows you how to do exactly that — install, first chart, the heatmap layer, real-time streaming — and how the same engine runs on both the web and native desktop.
We build kline-orderbook-chart, so the code samples use it. The concepts (one canvas, O(rows) append, command-buffer rendering) apply to any library you evaluate — bring your own candidate and hold it to the same bar.
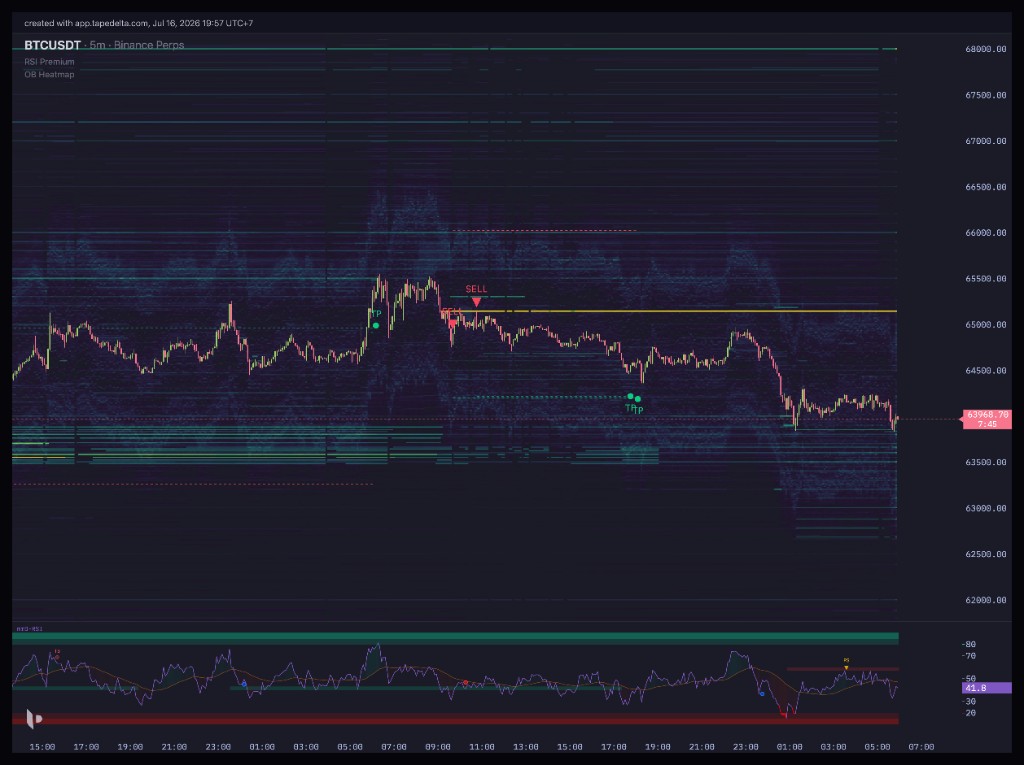 A live BTCUSDT chart: candles in front, orderbook depth heatmap behind, one canvas, one axis pair.
What "kline + orderbook heatmap" actually means
Two views, one plane:
- Kline (candlesticks) — OHLC per bar: what price did.
- Orderbook heatmap — a 2D raster of resting limit-order liquidity: time on X, price on Y, each cell colored by resting size. Bright bands are large walls of liquidity; dim areas are thin. This is what price has to trade through.
The hard part is not drawing either one. It is drawing them together so that:
- there is a single
<canvas>element, - the heatmap is a colored raster occupying the price/time plane,
- candles render on top, transparent in their negative space so the heatmap shows through,
- pan, zoom, scroll, crosshair, and the time axis stay locked between both layers,
- the frame budget holds at 60 fps with a ~200×500 heatmap matrix plus a thousand candles.
If two views sit in two DOM boxes, that is a layout, not a chart. The moment the trader pans, the layers ghost and lag. One canvas, one render frame, or it is not solving the problem.
Install and render your first candles
npm install kline-orderbook-chart
import { createChartBridge, prefetchEngine } from 'kline-orderbook-chart'

// Warm the engine while your data request is in flight (optional, faster first paint).
prefetchEngine()

const chart = await createChartBridge(canvas, {
  licenseKey: 'YOUR_LICENSE_TOKEN',
})

// timestamps in seconds; each array is one column of OHLCV.
chart.setKlines(timestamps, open, high, low, close, volume)
chart.start()
That is a full candlestick chart. createChartBridge returns the chart instance; setKlines hands it columnar OHLCV; start() begins the render loop. Call chart.destroy() on unmount to free the engine.
Add the orderbook heatmap
The heatmap is a flat matrix of resting sizes plus the geometry that maps it onto the price/time plane:
// matrix: Float32Array of length ROWS * COLS (row-major), each cell = resting size.
// xStart/xStep: time of the first column + seconds per column.
// yStart/yStep: price of the first row + price per row.
chart.setHeatmap(matrix, ROWS, COLS, xStart, xStep, yStart, yStep)
That is the entire heatmap API. The engine buckets the matrix into the current viewport, interpolates the palette, and paints it behind the candles in the same frame. Bright cells are large resting walls; the candles you already loaded now sit in front of the liquidity they are trading into.
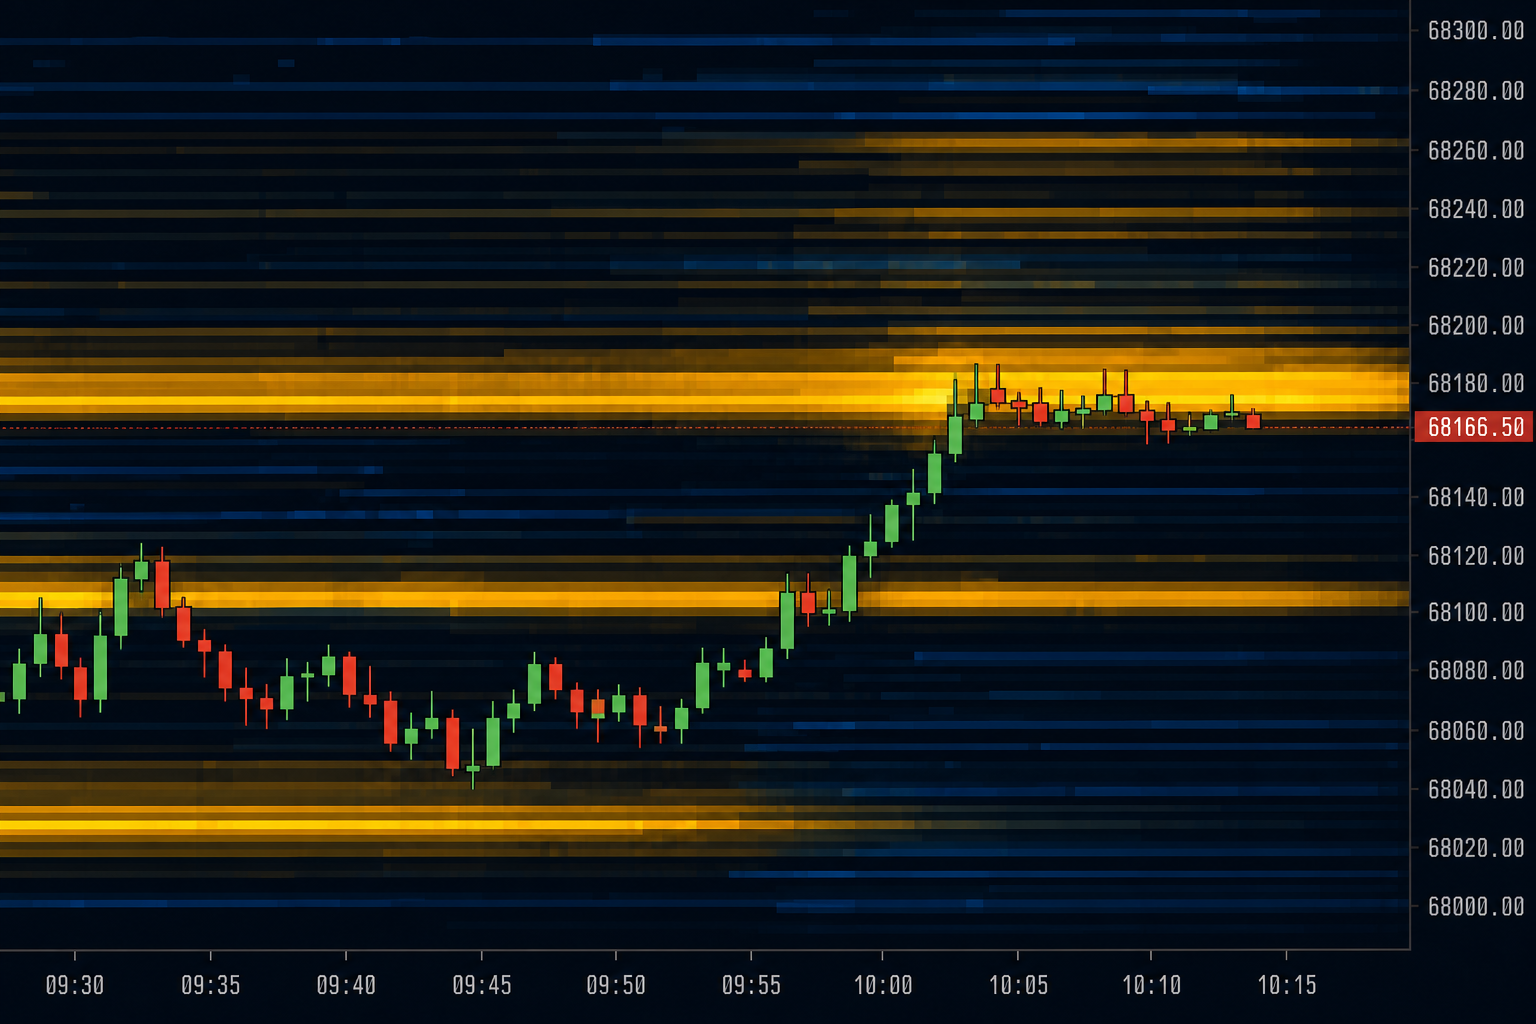 Zoomed in: candles pressing into a bright resting-liquidity wall — the setup you cannot see on a bare candle chart.
Stream it in real time
A live chart takes an orderbook snapshot (or delta) every ~100 ms and a trade tape continuously. Feed both without re-rendering the world:
// New/closing bar from your kline socket:
socket.onKline((k) => {
  chart.appendKline(k.ts, k.open, k.high, k.low, k.close, k.volume)
})

// New orderbook column from your depth socket:
depthSocket.onSnapshot((snap) => {
  // Build the latest column into your rolling matrix, then hand it back.
  chart.setHeatmap(matrix, ROWS, COLS, xStart, xStep, yStart, yStep)
})
Two properties make this hold up under a fast tape:
appendKlineis O(1) amortised — a new bar does not re-aggregate history.- A heatmap column costs the rows it touches, not the whole matrix — appending is cheap even at 10 Hz.
The render loop batches all of this into animation frames, so incoming messages never trigger a synchronous repaint. That is the difference between a demo with static data and a chart a trader can actually watch during a fast move.
One engine, two targets: web and native
Here is the part most libraries cannot claim: the same engine runs on the web and inside a native desktop app. The core computes a renderer-agnostic command buffer every frame — an abstract list of "fill this rect, stroke this line, draw this text". On the web, a thin layer dispatches that buffer to a canvas. In a native Rust app, you dispatch the identical buffer through your own painter.
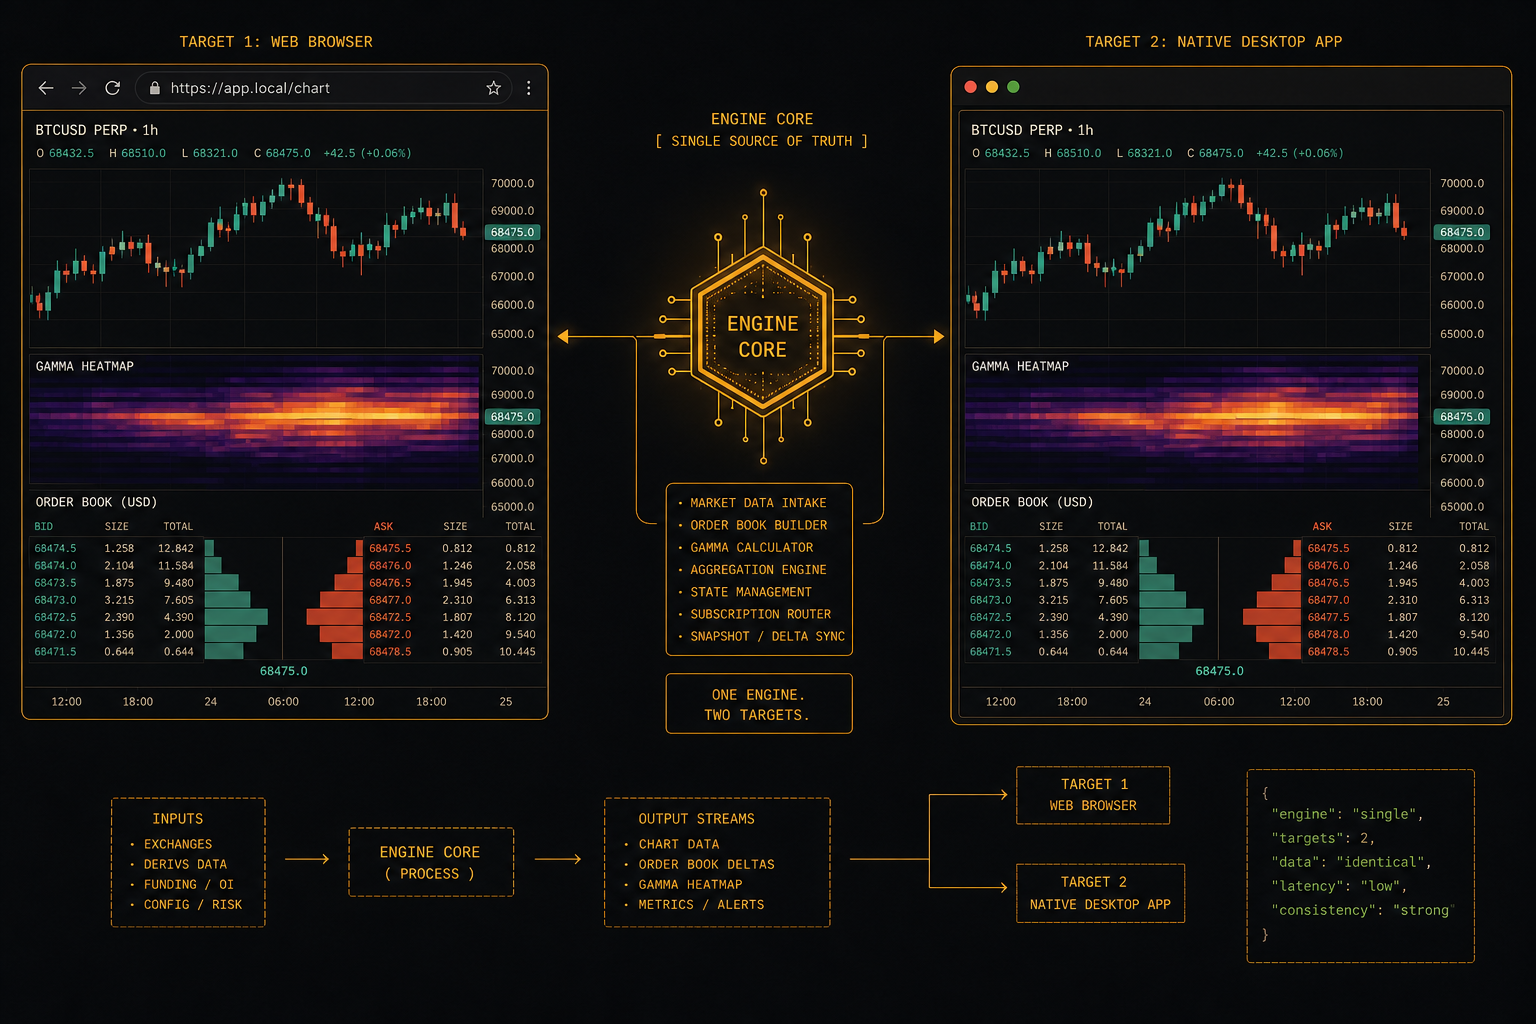 Identical command stream, two front-ends: a browser canvas and a native window.
A ready-to-read GPUI adapter ships as a reference, so a Rust/GPUI desktop app can embed the exact chart you shipped on the web — same candles, same heatmap, same numbers. If you are building a native trading terminal, read the companion post: Building a Native GPUI Chart in Rust: GEX Gamma Heatmap From One Engine.
Beyond the heatmap
Resting liquidity is one layer. Teams that want it usually want the rest of the order-flow stack, and it is in the same engine:
- Footprint cells — executed bid×ask volume inside each candle, with POC, delta, and stacked-imbalance detection.
- Liquidation heatmap — an overlay of liquidation clusters.
- 18+ indicators — VRVP, CVD, TPO, RSI, MACD, Open Interest, Funding, and more, in shared subplots.
- Custom indicators — a scripting language so non-developers can build their own without forking your dependency.
No plugin store to vet, no version skew between the core and a footprint add-on. If it ships, it works.
Common pitfalls
- Two canvases "aligned" by CSS. The instant the user pans, the layers drift by a frame and ghost. The heatmap and candles must be one canvas on one render frame — check this in a vendor's pan demo, not a screenshot.
- Re-sending the whole matrix on every tick. If a library re-uploads the full matrix per snapshot, it dies at 10 Hz. Confirm the append cost is O(rows touched).
- DOM-per-cell heatmaps. A 200×500 matrix is 100,000 cells; as DOM nodes or
<rect>s the browser collapses on the first pan. The heatmap must be a raster (canvas/native), not the DOM. - Forgetting
destroy(). The engine holds a memory buffer; not callingchart.destroy()on unmount leaks it across route changes. Wire it into your framework's teardown.
Where to go next
- Choosing an Orderbook Heatmap Chart Library: A Buyer's Guide — the rubric to score every candidate, including ours.
- Trading Chart With Depth Heatmap: A Practical Guide — what the view looks like in production.
- How to Read an Orderbook Heatmap — 5 Patterns — the trader-facing companion.
- Building a Native GPUI Chart in Rust — the same engine, native.
- Docs: Charting Library · Getting Started · Orderbook Heatmap
- Code: GitHub — kline-orderbook-chart · npm
Built with kline-orderbook-chart — free for development, commercial licences for production. This article is education for developers, not financial advice. Trading involves risk.