
Order flow, made
legible
Most charts show you the candle. Tape Delta shows you what built it — resting liquidity, leverage clusters, executed size and volume at price, all on one axis.
One ecosystem, four ways in
Web App
app.tapedelta.comThe hosted order-flow terminal, scanners, signals and execution.
TradingView
Invite-only studiesFlip Zone, Smart Ranges, Signals Premium, RSI Premium. No repaint.
Delta DSL
In-chart scriptingWrite your own indicators and alerts in a sandboxed language.
Charting Library
npm packageEmbed the same engine — heatmap, footprint, DOM — in your product.
What actually happens
Every venue and every feed lands on the same engine — so the heatmap, the footprint and the signal all agree on one price axis.
- Depth (L2)
- Trades / tape
- Liquidations
- Open interest
- Funding
- Options GEX
Who it is for
Nobody needs all of it. Find your row — those are the panels to turn on first.
You read the tape
Where liquidity rests, who gets absorbed, what the last 200 prints did.
- Footprint charts
- Orderbook heatmap
- Liquidation heatmap
- DOM ladder
- Large trades
- CVD
- VPIN
- Walls
You trade structure and levels
Ranges, trendlines and value areas — with confirmation before you commit.
- Volume profile
- TPO market profile
- Smart Ranges
- Drawing tools
- RSI & EMA
- Bar replay
You want setups delivered
A shortlist instead of a screen, and optionally the execution too.
- Futures, Spot & Forex signals
- Live signals on chart
- Price & indicator alerts
- Telegram & webhook
- Auto Trade
You scan before you trade
Find the one market behaving differently, then drill into it.
- RSI heatmap
- Alt & chart screeners
- OI / CVD patterns
- Funding
- GEX gamma
- Whales screener
You are building something
Order-flow charts inside your product, or an indicator nobody wrote yet.
- kline-orderbook-chart
- Delta DSL scripting
- Framework-agnostic
- Domain licensing
How you use it
Discover
Scanners & screenersSweep hundreds of pairs, sort by the anomaly.
Analyse
Chart terminalConfirm it on depth, footprint and delta.
Get alerted
Alerts & signalsIn-app, push, Telegram or webhook.
Execute
Manual · Semi · Full autoOrder routes to your own exchange key.
Review
History & AI explainerSee what worked, then sweep again.
The DOM and the tape, on the chart's price axis
Resting depth, executed prints and the DOM ladder rendered against the same axis as the candles — streaming live, GPU-accelerated, in a browser tab.
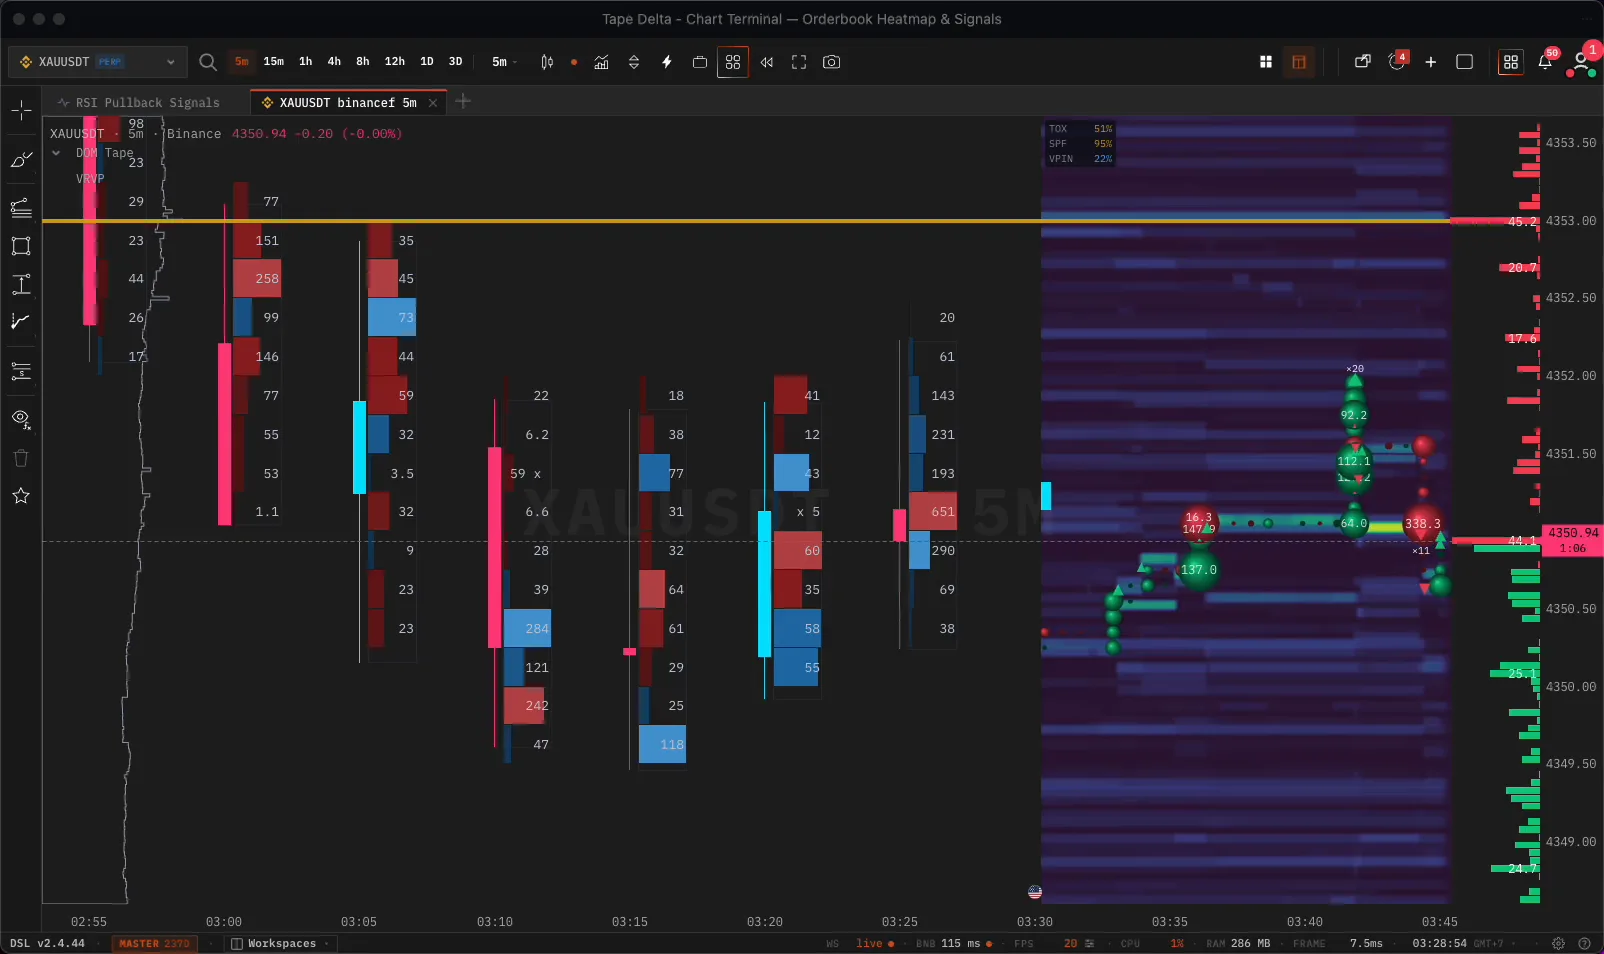
DOM Tape columns
Bid and ask size printing per level as it trades, inside the chart rather than a side window.
Orderbook heatmap
Resting depth streaming right of the last candle — bands build as size is added, fade as it is pulled.
DOM ladder on the axis
Queued size drawn on the price scale itself, so the ladder and the candles cannot drift apart.
Runs in a browser tab. And on your phone.
Order flow used to mean a desktop install, a separate data-feed client and a machine to run them on. This is a URL.
No install, no plugin
A browser tab. No desktop client and no separate data-feed app holding RAM in the background.
GPU on a single canvas
Every layer draws on one hardware-accelerated canvas. The frame counter in the clip above stays under ten milliseconds.
Full order flow on mobile
Same heatmap, same footprint modes, same indicators and trade controls — relaid for one thumb, not stripped down.
Any machine you have
The work happens on the GPU you already own; an older laptop runs the same terminal a workstation does.
Frequently Asked Questions
Is there an order flow terminal that runs in a web browser?
Yes — this one. The orderbook heatmap, footprint charts, DOM ladder, trade tape and volume delta all render in a browser tab on a single GPU-accelerated canvas. There is no desktop client to install, no plugin, and no separate data-feed application eating your RAM in the background.
Can I read order flow on a phone?
Yes. The mobile build is a parallel layout, not a cut-down one: the same orderbook heatmap, the same footprint modes, the same indicators, the same trade controls, laid out for one thumb. The toolbar collapses into a More menu, the side panel becomes a swipe sheet, and the chart fills a single pane. Multi-pane layouts stay desktop-only.
What is a DOM, and what is a DOM tape?
DOM stands for Depth of Market — the ladder of resting limit orders above and below price, showing how much size is queued at each level. The tape is the stream of executed trades. A DOM tape puts both on the same ladder, so you watch resting liquidity being consumed by actual prints instead of inferring it from a candle.
Why does sharing one price axis matter?
A level only means something at an exact price. When the DOM, the tape and the depth heatmap each live in their own window with their own scale, you are aligning them by eye and losing the level. Rendering them against the candles' own axis means a wall, a print and a wick at the same price land on the same row.
What is Tape Delta?
An order-flow trading platform. It shows where liquidity actually sits and where it gets consumed — resting bids and asks, leverage clusters, executed size, volume at price — rendered behind the same candles on one price axis. It ships as a hosted terminal, TradingView studies, an in-chart scripting language, and an embeddable charting library.
Who is it for?
Order-flow traders reading the tape, technical traders marking structure, traders who prefer to follow and automate signals, analysts scanning hundreds of markets, and developers embedding order-flow charts. You are not meant to run all of it — pick the profile that matches how you trade.
Do I need to understand order flow to start?
No. Most people arrive from classic technical analysis and begin with what they already know — candles, volume profile, RSI, drawing tools, alerts. The order-flow layers sit on the same chart, so you can add them to a setup you already trade and see what they add first.
Which markets and venues are covered?
Crypto spot and perpetuals across Binance, Bybit, OKX, Hyperliquid and others; CME futures such as ES, NQ, CL and GC; and forex and metals through MetaTrader 5. Where a venue does not publish a given feed, the chart falls back to what it does provide rather than showing a blank pane.
Is there a free plan?
Yes. The chart terminal, the scanners and signal monitoring are open on a free account, no card required. Paid tiers unlock the heavier data layers and automated execution.
Does Tape Delta hold my funds?
No. It is not an exchange, broker or custodian. Execution routes through your own exchange API key, which is trade-only with withdrawal disabled, so a leaked key cannot move funds.
Can I use it on TradingView, or inside my own app?
Both. We publish invite-only studies on TradingView for the charts you already keep there, and the charting library that renders our own terminal is available as an npm package. Delta DSL lets you script custom indicators inside the terminal itself.
Start with the part you need
Free account, no card. Turn on the rest when you want it.
Create Free Account