What Is Tape Delta? The Order-Flow Analytics Terminal
Tape Delta is an order-flow analytics platform: orderbook heatmap, footprint, DOM ladder, liquidations, CVD, options GEX, RSI scanners, signals, alerts and autotrade in one workstation.
Most trading tools show you a candlestick chart and a handful of lagging indicators layered on top. That tells you where price went. Tape Delta is built around the harder, more valuable question — what the market is actually doing to get there: who is hitting the bid, where the resting liquidity sits, which side is absorbing, where leverage is stacked, and how positioning is shifting in real time. It is an order-flow analytics terminal that puts the orderbook heatmap, footprint, DOM ladder, liquidations, CVD, open interest, options gamma, RSI scanners, signals, alerts and autotrade on one screen.
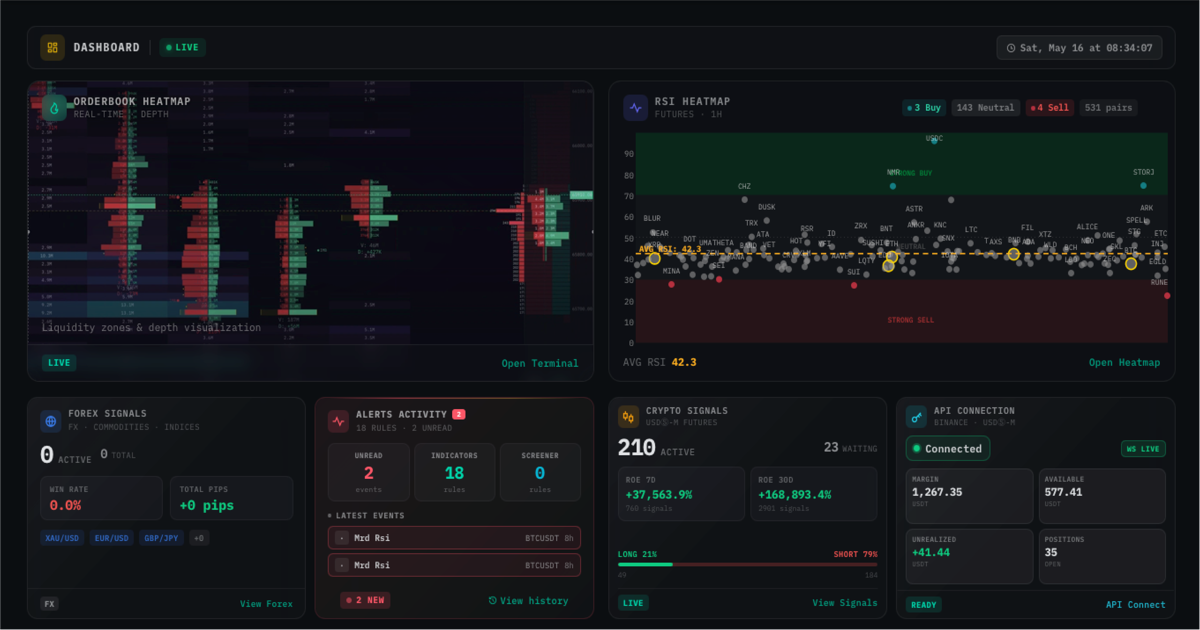 One workstation. Every panel — orderbook heatmap, footprint, RSI heatmap, signal stack, autotrade, alerts, screeners — reads from the same realtime data plane, so the depth you see in one place is the depth you act on in another.
The name is the thesis. The tape is the raw stream of executed trades — every aggressive order that crossed the spread, in sequence. Delta is the running score of aggressive buying minus aggressive selling. Read together they tell you who is winning the fight for price right now, before it shows up as a completed candle. Everything in the platform is a different lens on that same idea.
Why order flow, not just price
A normal candle is a summary written after the fact. By the time a bearish candle closes, the selling that made it is already over. Order-flow tools let you watch the cause instead of the result:
- Resting liquidity — where limit orders are stacked as walls of size the market has to get through.
- Aggression — who is crossing the spread to get filled now, and how hard.
- Absorption — heavy aggression that hits a level and fails to move it, one of the strongest reversal tells in microstructure.
- Forced flow — liquidations that fire as market orders and accelerate a move rather than stop it.
- Positioning — open interest, CVD and options gamma, which frame the regime the tape is playing out inside.
If you are coming from classic technical analysis, this is not a replacement for support/resistance or RSI — it is the layer underneath them that explains why a level holds or breaks. New to the vocabulary? Start with How to Read the DOM Ladder and How to Read an Orderbook Heatmap — those two build the foundation this whole terminal stands on.
The chart terminal — the core surface
The heart of Tape Delta is a multi-pane chart terminal at app.tapedelta.com/trading/chart-terminal. It runs a single high-performance canvas engine, so you can stack every one of the views below on the same chart without it slowing to a crawl — and pan, zoom and hover stay smooth even on hundreds of thousands of bars.
Orderbook depth heatmap
The depth heatmap paints resting bid/ask liquidity over time as horizontal stripes, so you can watch walls form, persist and get pulled. It is the history of the book — the companion to the live ladder read. Deep dive: Trading Chart with Depth Heatmap: Complete Guide.
DOM ladder, depth profile & tick tape
Beside the chart sit three microstructure modules: a vertical DOM ladder (price-by-price resting size, aggressive buy/sell volume and per-level delta, live), a multi-exchange depth profile, and a raw tick-stream tape of executed trades. These are the closest read you can get to the raw tape itself.
Footprint
The footprint chart splits every bar into bid volume and ask volume at each price, colours the delta, and highlights the point of control — so you see inside each candle who traded where. It surfaces stacked imbalances and exhaustion the candle body hides. Learn it in What Is a Footprint Chart: Complete Guide and Stacked Imbalances on the Footprint Chart.
Liquidation heatmap
The liquidation overlay estimates where leveraged positions are most likely to be force-closed and plots them as bright clusters on the chart. Read as fuel rather than as walls, these often accelerate a trend through them. Full framework in Liquidation Heatmap + RSI: Trading Long-Term Trend Waves.
CVD, CVD profile & open interest
CVD (cumulative volume delta) tracks aggressive buying minus selling as a running line; the CVD profile breaks that delta down by price. Paired with open interest — how much leverage is entering or leaving — they tell you whether a move is driven by new positioning or short-covering. See Trading with the CVD Profile and What Is Open Interest: OI + CVD Guide.
Options GEX
For BTC and ETH — plus gold and major US index ETFs — the Options GEX panel adds a positioning lens from the options market: net gamma exposure, the gamma flip, call and put walls and max pain, drawn directly on your candles. It tells you whether you are in a pinning regime (fade the edges) or a trending regime (chase the break). Start with What Is GEX? Gamma Exposure Guide, then GEX Heatmap Explained and the GEX chart overlay.
Indicators, drawings, replay & quick trade
On top of the order-flow views the terminal ships 18+ built-in indicators (RSI, EMA, VRVP, TPO, VPIN, VWAP, funding and more), a full drawing-tool set, a bar-replay mode for practising your read on historical tape, and a quick-trade bar to fire orders straight from the chart once your API is connected.
Scanners & screeners — finding the chart worth watching
Order flow is only useful once you know where to point it. Tape Delta ships three tools that scan the whole board so you are not clicking through symbols one at a time.
- RSI Heatmap — multi-timeframe RSI across 500+ pairs at a glance, so you see which coins are stretched and which timeframes agree. Background reading: RSI: Momentum, Value and Structure.
- Altcoin Screener — rank and filter the altcoin board by the metrics that matter to your setup.
- Whales Screener — surface unusually large trades and flow as they hit the tape.
Signals & autotrade — from read to execution
Around the terminal are three signal hubs — USDⓈ-M Futures, Spot and Forex — where quantitative outputs of the indicator suite are collected, timestamped and delivered. Each signal is a transparent output you can inspect on its own chart, not a black box.
The autotrade engine closes the loop: it can execute futures signals on your Binance Futures account in semi-auto (you confirm each entry) or fully-auto mode, inside a risk envelope you set — per-trade risk, max concurrent positions and TP/SL templates. Two things stay non-negotiable: execution runs through your own API key with trade-only scope, and Tape Delta never has withdrawal permission and never touches your funds.
Alerts — one inbox for everything
A unified alerts inbox collects indicator alerts, screener hits, signal events and price triggers into one place, delivered by web push, Telegram and in-app — so you can step away from the screen without missing the setup you were waiting for.
Build your own — Delta DSL & the wider ecosystem
If nothing in the catalog plots your edge quite right, Delta DSL is a focused in-chart scripting language for authoring custom indicators that run on the same engine as the built-ins. You declare inputs, choose an overlay or a sub-pane, and use a math-and-draw standard library — inside a sandbox that keeps author-submitted scripts safe to share.
Two more surfaces round out the ecosystem, aimed at users who live elsewhere:
- TradingView studies — invite-only Pine indicators (Flip Zone, Smart Ranges, Signals Premium, RSI Premium) that layer onto your existing TradingView workflow.
- Charting library — the
kline-orderbook-chartnpm package that powers the whole terminal, for teams embedding an order-flow chart into their own product. Context: The Kline Chart + Orderbook Heatmap Library.
There is also a rebates program that returns a share of fees on trades routed through partner brokers.
Who Tape Delta is for
- Order-flow and scalp traders who want depth, footprint and the tape on one fast screen.
- Swing and position traders who use liquidations, OI, CVD and options GEX to frame the regime.
- Classic-TA traders looking to add the why underneath their levels and RSI.
- Signal followers and semi-systematic traders who want signals plus optional automated execution with real risk controls.
- Quant authors and developers who want to script their own indicators or embed the chart layer.
Common mistakes to avoid
Even with every tool on one screen, the ways traders trip over an order-flow terminal are predictable:
- Stacking every panel at once. More views is not more signal. Pick two or three lenses that answer your question (e.g. heatmap + footprint for scalps; liquidations + OI + RSI for swings) and let the rest stay off until you need them.
- Trusting a wall before it is tested. Spoofed size that appears and vanishes before price arrives is common in crypto. Wait to see whether size is actually consumed. The DOM ladder guide covers the tells.
- Reading liquidation clusters as support/resistance. Forced liquidations execute as market orders in the painful direction — a cluster in the path of a trend is usually fuel, not a wall.
- Chasing signals without a risk envelope. If you turn on autotrade, set per-trade risk, max positions and TP/SL first. A good signal with bad sizing is still a bad trade.
- Confusing GEX levels with real orders. GEX is a model-based estimate of dealer positioning, not a record of resting orders — use it for regime and levels, confirmed by the tape.
Where to go from here
- How to Read the DOM Ladder — the live order-flow read, column by column.
- Trading Chart with Depth Heatmap: Complete Guide — the resting-liquidity history lens.
- What Is a Footprint Chart: Complete Guide — reading inside the candle.
- What Is GEX? Gamma Exposure Guide — the options positioning lens.
- Liquidation Heatmap + RSI — the forced-flow lens for long-term waves.
The fastest way to understand Tape Delta is to open it on a chart you already trade. Create a free Tape Delta account, open the chart terminal, and add the depth heatmap and footprint on BTC — then watch a level hold or break in real time, before the candle even closes.
This article is education, not financial advice. Order-flow tools describe market behaviour and model-based estimates, not guaranteed outcomes. Trading involves risk; never risk capital you cannot afford to lose.