Introduction
One trading workstation, four surfaces — the web app, the TradingView indicator suite, the in-chart scripting language, and the embeddable charting library. Start here.
Tape Delta is a professional market analytics workstation built around what the market is actually doing — orderbook depth, footprint, liquidations, multi-timeframe RSI, and real-time signals — not just where price went. It ships as one ecosystem with four entry points: a hosted web app, a suite of TradingView studies, an in-chart scripting language, and an embeddable charting library that powers them all.
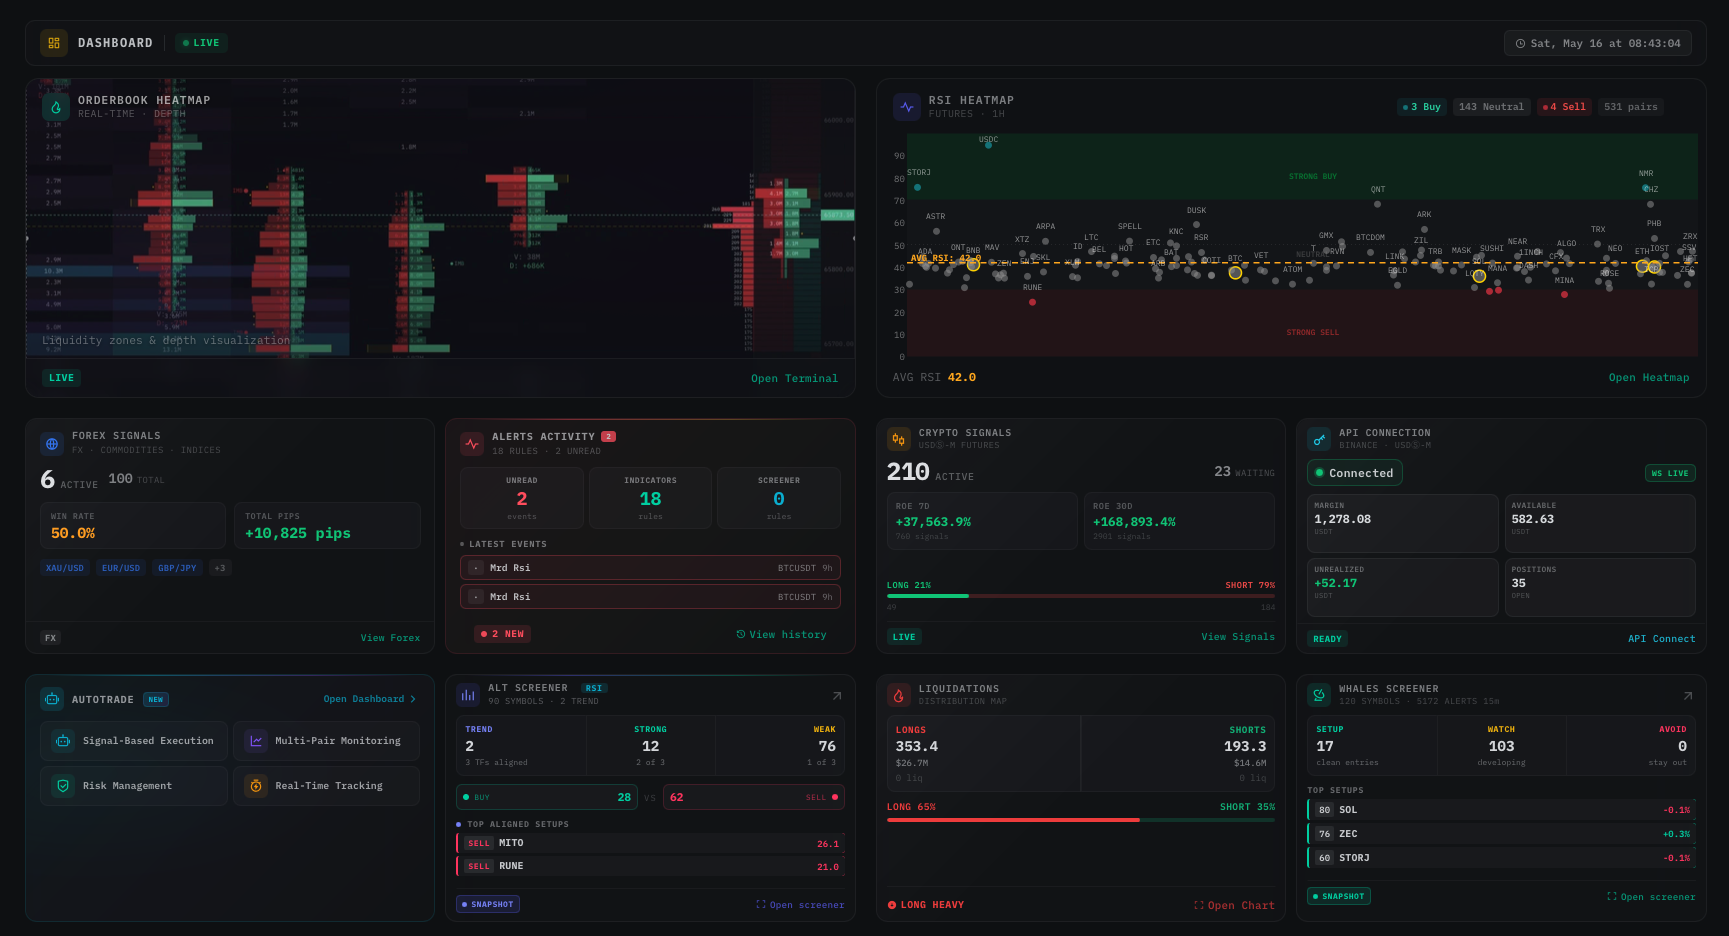 A single dashboard view of the web app. Every panel — orderbook heatmap, RSI heatmap, signal stack, autotrade, alerts, screeners — is wired to the same realtime data plane.
Four surfaces, one ecosystem
Pick the surface that matches how you work. Each one stands on its own, but the data, the indicators, and the visual vocabulary stay consistent across all of them — what you read on the web app is the same depth, the same footprint, the same liquidation cluster you would see in the embedded chart inside your own product.
Web App — the hosted workstation
The web app at app.tapedelta.com. A multi-pane chart terminal with depth heatmap, footprint, liquidation overlays, 18+ indicators, drawing tools, replay, and a quick-trade bar. Around the terminal: RSI heatmap scanners for 500+ pairs, an altcoin screener, a whales screener, futures / spot / forex signal hubs, an autotrade engine that routes signals to your own Binance Futures account through your own API key (semi-auto or fully-auto), a unified alerts inbox, and a rebates program for trades routed through partner brokers. Start here if you are a trader who wants the tools ready out of the box. Read the Chart Terminal overview to see the full surface.
TradingView Indicators — invite-only studies for TradingView users
If you already live inside TradingView, our published Pine studies (Flip Zone, Smart Ranges, Signals Premium, RSI Premium) plug straight into your existing layouts. You link your TradingView username on your Tape Delta profile, accept the invite, and the studies appear alongside your other scripts. Start here if you already have a TradingView workflow and want to layer our signals on top of it. Read the TradingView Indicators overview for the catalog and setup flow.
Delta DSL Script — author your own indicators inside the chart
A focused scripting language for writing custom indicators that run on the same engine as the built-ins. Authors declare inputs (@input), choose a target (@pane for sub-pane plots, otherwise overlay), and use a math-and-draw standard library. The runtime is sandboxed by construction — scripts cannot reach the network, cannot read browser globals, and run inside hard loop and draw-count caps — which is what lets us host author-submitted scripts safely in a marketplace model. Start here if you have a setup that nothing in the catalog plots quite the way you want. Read the Delta DSL Script overview for the grammar and standard library.
Charting Library — embed the engine in your own product
kline-orderbook-chart is the npm package that powers everything above. Framework-agnostic, native-speed, single canvas. One install gets you candles, orderbook heatmap, footprint, liquidation overlays, 18+ indicators, drawings, and a <canvas>-mounted engine that hits 60 fps on 100 K bars. There are three standalone modules in the same package — a vertical DOM ladder, a multi-exchange depth profile, and a tick-stream tape — that you can drop in beside the main chart. Start here if you are building a trading product and need the chart layer as a dependency, not a hosted app. Read the Charting Library introduction and the getting-started guide.
Who this documentation is for
- Active traders evaluating the web app — head straight to the Chart Terminal overview, then learn how to lay out a chart workspace and connect your exchange API.
- TradingView power users who want our signals as overlays — start at TradingView Indicators.
- Quant authors who want to encode their own setups — start at Delta DSL Script.
- Engineering teams building trading products — start at the Charting Library introduction.
How the docs are organized
The left sidebar groups every page under one of the four sections above. Within each section, related pages are bundled into groups — for example, "Chart Terminal", "Auto Trade", and "Alerts" inside the Web App, or "Core API" and "Standalone Modules" inside Charting Library. The right rail shows the table of contents for the page you are reading. Search is in the top bar (or Cmd-K).
What this platform is not
Tape Delta is a market analytics platform — a tool for reading and analysing markets. A few things it deliberately does not try to be — knowing what is out of scope is part of evaluating whether it fits your workflow.
- Not an exchange, broker or custodian. Tape Delta is not a trading venue and is never a counterparty to your trades. All trade execution flows through your own exchange API key (Binance Futures today), under your technical authorization. We never hold your funds, never receive your money, never custody anything, and never see your withdrawal permission — your assets stay on your own exchange at all times.
- Not financial advice. Signals are quantitative outputs of indicators. Sizing, risk, and the decision to take any trade is yours.
- Not a general-purpose data tool. The lens is trading. If you need a dashboard for marketing analytics or BI, this is the wrong shape.
Next steps
- New here — start with the Chart Terminal overview.
- Want signals? — pick the Trading Signals hub that matches what you trade: USDⓈ-M Futures, Spot, or Forex.
- Already a user — jump straight to the section that matches what you build next: TradingView Indicators, Delta DSL Script, or Charting Library.
- Building on top of us — the Charting Library getting-started walks you from
npm installto a live candle chart in five minutes.